株にはなぜ値が付く?日本の先行きへの考察/What is pricing Equities? A consideration toward the future in Japan
株式には「値段」がついている
株式会社は自社の持ち分を細分化した有価証券である「株式」を発行する。もう少し具体的に言うと、会社の「貸借対照表(バランスシート)において、総資産から総負債を除したもの」である純資産を所有することを証するのが株式だ。非常に単純化した言い方をすれば、たとえばある株式会社の純資産が100億円で、株式を1億株発行していたとすれば株式1枚で100円の純資産の保有を証することになる。そしてその会社が上場企業であれば発行した株式を市場で公開して誰でも自由に売り買いできるようにする。こうしたシステムは資本主義の根幹をなす社会システムだ。
Each Equity is priced in the markets
Joint stock companies issue stocks which certify stakes of their holdings. More concretely the Equity certificates the holdings of “Net Asset (Total asset-Debt)” of the Balance Sheet. Simply speaking, when you own 1 share and the company of \10 billion Net Asset issues 100 million shares, you hold \100 Net Asset of the company. And if the company is listed in stock markets, anybody can buy and sell those equities. This is the very fundamental social system which forms the Capitalism.
(English text continues to the latter half of the page)
このように市場で自由に売り買いされる株式の価格を「株価」と言うが、その株価は日々の売り買いによって常に変化する。前述したように1株当りの純資産額は株価の裏付けの一つではあるが、実際の株価は100円に留まっていることはなく、その水準は50円にもなれば200円にもなる。こうした株価水準がどのように決定されるのだろうか。実はこの疑問に対する正確な答えを出せた人間はいまだに存在しない。もちろん“ある一定の条件では正しい”という仮説は無数に現れているが、あらゆる株価の決定原理そのものを説明できた人間はいない。もっともその原理を100%説き明かせることができたら、それを社会に発表するよりも誰にも黙って株で大儲けする方が得策かもしれないが、そのようにして世界一の大金持ちになったという人間の噂も聞かない。
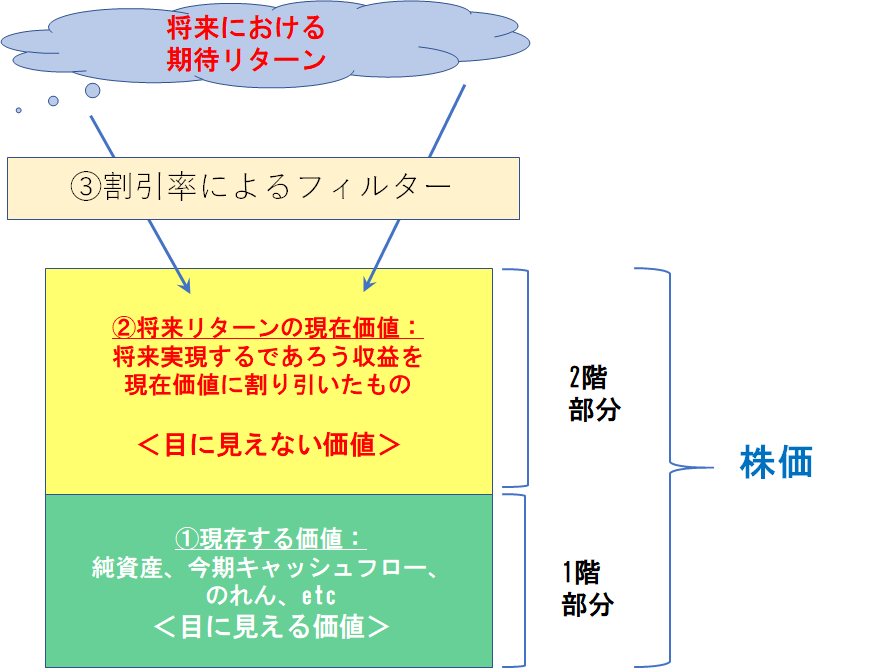
株価の決定原理そのものは不明としても、一般論の範囲内ならば株価の方向性の議論くらいはできそうだ。ここでもひとつの仮説として下の図を見てみよう。
株価は「2階建て構造」、株価を動かす3つのファクター

株の世界に30年以上携わってきて強く感じるのは、株価と言うものは一般的に2階建て構造をしているということだ。まず1階部分は“すでに目に見えている価値”、すなわち前述の純資産、あるいは今期予想キャッシュフロー、(売却可能な)ブランド価値、などを反映したもの。株価指標に「株価純資産倍率(PBR):株価÷1株当り純資産」というものがあるが、これはここに属する株価の直接の裏付けでもある1株当り純資産の何倍まで株価が値付けられているのかを表す指標だ。ちなみに東証1部全銘柄の2017年11月末におけるPBR平均は1.39倍になる(日本経済新聞調べ)。
しかし株価形成の本来の主役は2階の部分、すなわち企業が将来にわたって生み出す価値を現在価値に割り引いたものではないだろうか。上場企業は「ゴーイング・コンサーン(継続企業)」が前提であり、将来にわたって収益を生み出していくと考えるのが原則。そのような将来の収益の多寡も現在の株式の価値に反映されるべき。もちろん将来の収益ポテンシャルの合計がそのまま現在の株価に蓄積されることはなく、市場ではこの将来の収益については一定の割引率をもって「現在価値」に割引かれて株価に反映されるとみているようだ。ちなみにこの割引率も状況に応じて目まぐるしく変わる。日本の公定歩合は0.3%であり(2017年11月末)、株式の(将来の不確かさを調節する)リスクプレミアムを5%と置いた場合、「割引率」は5.3%。仮にある企業が1年後に1株当り50円の利益を挙げると考えらえる場合には「47.35円:50円-(50×0.053)」が現在価値になる。さらに2年後に30円の利益が挙げられる場合には「26.82円:30-(30×0.053×0.053)」が現在価値になる。もっともこの割引率はアナリストの調査レポートなどでは株式全般に共通のレートを用いて分析されることが多いが、実際には銘柄ごとに大きく違い、しかも刻一刻と大きくその水準を変えるものと見た方が良さそうだ。また日銀が発表する政策金利と違い、この割引率は概念上の存在でその正確な水準は誰にもわからない。仮にネガティブな経済的イベントが発生した場合には、将来の収益へのファンタジーが急速に萎むと同時に先行き不透明感から割引率も大きく上昇し(現在価値への割引が大きくなる)、株価に大きなネガティブ・インパクトを与える。会社の業績はそう簡単に短期間で激変するものではないが、株価の方は平気で半分になったり2倍になったりその振幅は現実の業績動向よりもはるかに大きいのはここに理由があるのではないか。
こうしてみると、日々の株価を動かす要因は図にも示した3つの要因、すなわち「①現存価値」、「②将来リターンの現在価値」、「③割引率」の3つに想定されてくる。これら3つの要因を現状の日本株市場に即して考えてみたい。
① 現在価値-足元の株式相場を支えているのはこれ
足元では日本株市場の腰の強さが目立っている。高値警戒感は続くものの大きな下落はなく、押し目らしい大きな押し目をまだ見せてくれない。このセンチメントを支える最もおおきなファクターがこれになるだろう。野村證券が2017年9月5日に発表した企業収益予想によると、日本株の代表的な指標であるRussel/Nomura Large Cap(除く金融)指数の2017年度第1四半期(4-6月)の経常利益増益率は前年同期比20.2%増益と、事前予想の同10.9%を上回った。これもあって2017年度通期の経常増益率予想も前回の10.1%増益予想から5.2ポイント上方修正の同16.2%増益となった。
さらに法人企業統計によると、企業の収益率を表す代表的な指標である売上高営業利益率は2017年度第1四半期に8.4%と1985年以来の高い数値を示した。こうした足元の企業収益基盤の底堅さが、現在の株式相場を支えていることは容易に想像できる。
② 将来リターンの現在価値-ここには依然として不透明感
そして株価形成の主役とした「②将来リターンの現在価値」については、まだ自信を持ちきれない不透明な予想が支配的と言えないだろうか。前述のRussel/Nomura Large Cap(除く金融)の2018年度経常増益率予想は7.5%と前回より逆に前回よりも0.6ポイントの下方修正となった。今期の増益幅が膨らみながら、その好調の機運が次年度以降にオンされることがない格好だ。株価指標をみると、先にみたようにPBR(株価純資産倍率)が1.39倍、PER(株価収益率)が16.64倍、これらの数字はかつてよりも大きく改善したとはいえ、ほぼ20倍前後の先進国水準に比べればまだ出遅れている。足元の収益状況が予想以上に改善したとはいえ、市場は決して来年度以降の継続的な収益改善に自信を持っていない。
③ 割引率-実はここが最大のかく乱要因?
日本の金利はほぼゼロだ。本来ならば低金利は経済の安定要因として捉えられることもあるが、日本の場合は“上げようとしても上げられない”状態、デフレとも併せて「世界でも最低の投資収益率」の表れと捉えられる傾向が強い。安倍政権は当初からインフレ率2%の目標を掲げて日銀とともにあらゆる手段を尽くしているが、その実現は程遠い。リスクフリーレートである公定歩合は0.3%に張りついたまま上がる気配はないため、ここに株式としてのリスクプレミアムを上乗せした「割引率」も低位のまま安定しているようにも見える。調査機関ごとに多少の違いはあっても、多くの場合の日本株式のリスクプレミアムは4.5‐6.0%と見られているようだ。
しかし企業収益全体の調査をする場合には株式全体で一律の数値を用いるリスクプレミアムは、実は銘柄ごとに大きくその値を変える性質のものではないか。少なくとも数十人のアナリストがフォローして分析レポートが発表されているトヨタ自動車と、まったくアナリストのフォローがない中小型銘柄とが、将来期待の不確かさも表すリスクプレミアムが同じ水準になるとは考えにくい。実は絶対的な低金利の下では低い水準と信じられている株式リスクプレミアムは、市場の低金利とは反比例して相当に高い水準で株価に大きな影響を与えているのではないか。
日本株の行方は結局、生産性のイノベーションにかかっているのではないのか
ただここまで見てきた3つのファクター分析は“所与”のもので、むしろ静的分析に近い。株価を大きく動かすのは、やはり企業活動にまつわるダイナミックな変化になる。
現在の日本経済にとって最大のチャレンジは「人出不足」、それも経済活動の過熱によるものではなく、若年層の少数化という人口ピラミッドの形状によるもので循環的な環境変化では解決不可能なものだ。こうした難局の中で政府は移民の議論ではなく、「働き方改革」という労働生産性の改善を目指している。
80-90年代にかけてドイツで働いたことがあった、日本企業の現地法人だけでなく、現地企業に一定期間出向して働いていたこともある。そして驚いたことはドイツ人がたっぷりの休暇をとりながらも、時間の使い方が実に効率的だったこと。労働生産性という観点で見ると、アメリカを100とした場合、日本の労働生産性は70強、あれだけバカンスをとり残業もしないドイツ、フランスが90程度だ。毎日遅くまで残業し有休も消化しない日本のサラリーマンの生産性がここまで低いことは大きなショックだ。
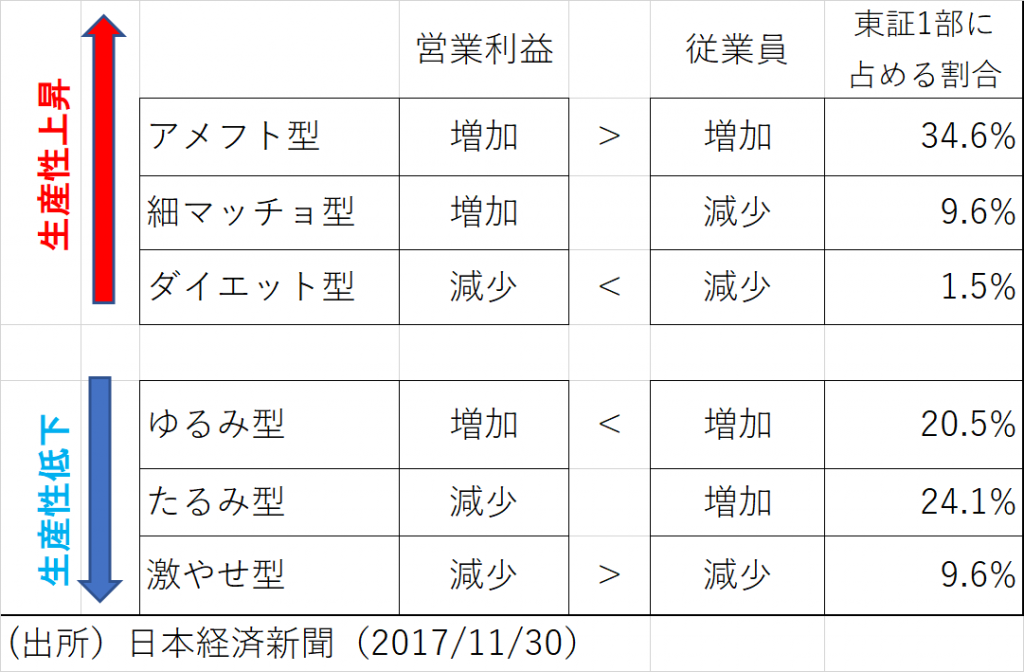
しかし日本経済新聞(2017/11/27)が面白い調査結果を発表した。過去10年間で生産性を改善した企業と、悪化させた企業を抽出してタイプ別にその割合を出した結果が下の図になる。

営業利益と従業員数の二つを取り出し、それぞれの変化によってタイプ別の分析をしたもの。生産性を上昇させた企業の中でも、営業利益を従業員数以上に増加させたのが最強タイプの「アメフト型」、逆に営業利益の減少率が従業員数の減少率よりも大きかったものを「激やせ型」として生産性低下の最も大きいタイプとした。結果として曲がりなりにも生産性を上昇させた3つのタイプの合計は「45.7%」、半数にも満たないので事態は深刻というのが記事の論調だった。ただ、これまで多くの企業の内部に入って調査してきた身としては、「アメフト型」が1/3以上の比率を占めたことが驚きだった。これまでミクロレベルの調査をしてて国内企業の苦闘を見てきた実感から行くと、「細マッチョ型」、すなわち従業員を減少させることによって営業利益の改善を実現させた“縮小均衡”型が逆に1/3以上を占めるのではないかと予感していた。同調査の結果はむしろ日本企業の生産性改善の可能性を示すものにも見える。
日本経済は戦後の高度成長の中で何度も危機を乗り越えて発展してきた。企業の生産活動が高まる中で公害が大問題となり、60年から70年代にかけての日本は汚染されたまま死を迎えると世界中から指摘されたこともあった。まるで現在の中国のようだ。しかし現在の日本はある意味で「環境先進国」と言える側面もある。日本の歴史は古来からスクラップ&ビルドの繰り返し、いったん同じ方向に向かいだすと一気に動きを加速するが、破滅の直前になって突然思い立ったように方向を転換して次のステージに向かっていく。現在の日本は未曽有の老齢化と人口減少が労働力不足と言う歴史的な危機として現れているが、もしも日本企業がこのような生産力危機に効率性改善を実現させて立ち向かうことができれば、日本株式の将来リターンへの期待も一気に改善することになる。もちろんこれは“分析”と言える代物ではない、しかしバブル崩壊以降20年以上にわたって不幸を吐き出したパンドラの箱から最後に生み出される希望かもしれない。
Each Equity is priced in the markets
Joint stock companies issue stocks which certify stakes of their holdings. More concretely the Equity certificates the holdings of “Net Asset (Total asset-Debt)” of the Balance Sheet. Simply speaking, when you own 1 share and the company of \10 billion Net Asset issues 100 million shares, you hold \100 Net Asset of the company. And if the company is listed in stock markets, anybody can buy and sell those equities. This is the very fundamental social system which forms the Capitalism.
Prices of equities are called Stock prices and they change their levels along trading in markets. As I described before, Net Asset per share is one of supports behind stock price but actual stock price never stays at \100. It can be \50 or \200. How are those prices decided? Nobody have been able to answer this question until now. Off course you can find many hypotheses which can be applied under “some specified circumstances”. However nobody have ever found the basic principle which explains stock price decision itself. Maybe you would make killing in stock markets without saying anything if you find such law. I have not heard about rumors of such a guy.
Stock prices are “2 floor structure”, 3 factors which move prices
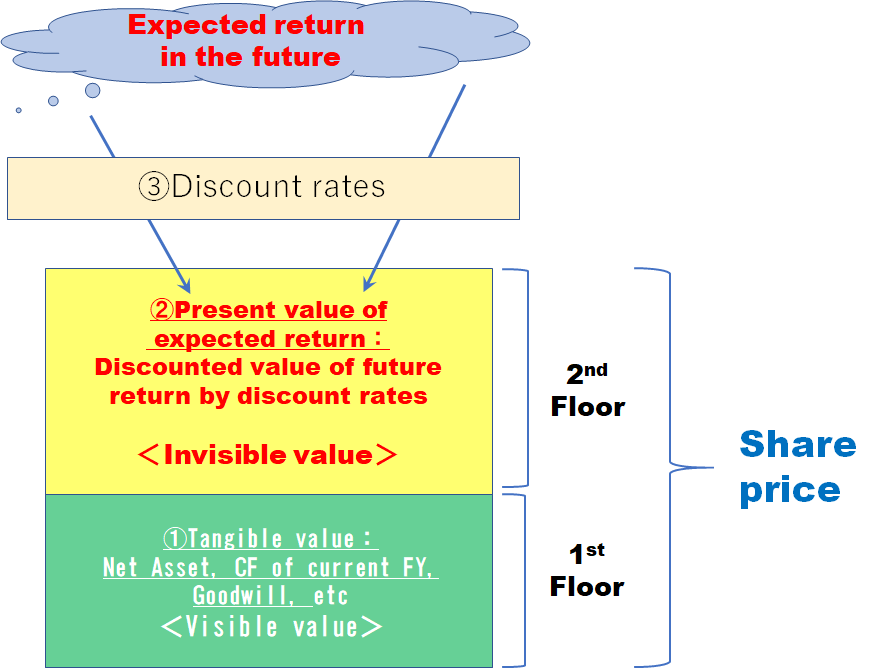
Even though the law of stock price decision is unknown, we can maybe discuss directions of price buildings in the scope of general theory. Can you take a look into the picture as followings.

I have been involved with equity markets more than 30 years, and I can’t help feeling that stock prices are “2 floor structure”. The 1st floor is so-called “Tangible asset”, namely visible asset like Net Asset, current FY’s cash flow, or (marketable) brand values. Price Book Value (PBR) is a representative stock price indicator which is the multiple of Book value per share (BPS). For comparison PBR of Tokyo Stock Exchange 1st section is 1.39 times at the end of November 2017 (Japan Economic Journal).
However the main player of stock price building must be 2nd floor part, namely present value of future expected returns which is discounted by “discount rates”. Listed firms are so-called “Going Concern” and they should keep raising profits even in the future. Future expected returns are discounted to present value through discount rates and this discount rates fluctuates very wild along circumstances. The official Discount rate in Japan is 0.3% and if the risk premium which adjusts uncertainties as equities is 5%, then the discount rate is 5.3%. For example, if a company is to raise \50 profit per share in 1 year, present value is \47.35, \50-(50×0.053). And then if \30 more is to be raised in 2 years, present value is \26.82, 30-(30×0.053×0.053). Although this discount rate is often applied just one rate for whole market, rates are possibly differed with each stock. And apart from something like Official discount rate, these rates are not visible but conceptional figure which exact level cannot be seen. Once negative economic events occur, future fantasy shrinks very quickly while discount rate goes up wild as uncertainties becomes huge. This could be a reason why stock prices often move much more wild than actual business results of companies.
Now we have 3 factors which move stock prices, “①Tangible asset”, ②Present value of future returns, ③Discount rate. Here I like to discuss those 3 factors and Japanese Equity markets’ direction.
① Tangible value-markets are sustained by this at moment
At moment Japanese stock markets stay pretty firm. Although concern over high level stay strong, no sharp weaknesses are not visible yet. Present value must be the one to sustain this bullish sentiment. As Nomura Securities pronounced in September, actual profit increase of Q1 FY2017 (April-June) of Russel/Nomura Large Cap (ex. Financial stocks) was 20.2% YoY against the latest forecast of 10.9%. And profit forecast of FY2017 was revised up to 16.2% from previous forecast of 10.1%. And moreover operating profit margin duringQ1 was 8.4% which was the highest level since 1984 according to MOF’s Financial Statements Statistics of corporations. It should be pretty sure that those solid and firm corporate activities are supporting present firm stock markets at moment.
②Present Value of future returns-this is still uncertain
It seems like that market participants are not very confident of future growth yet. The FY2018’s profit forecast of Russel/Nomura Large Cap was revised down to 7.5% against the previous forecast of 8.1%. The positive sentiment of current FY does not add on to next FY. If you turn out your eyes to stock price indicators like 1.39 times of PBR and 16.64 times of Price Earnings Ratio (PER), you find that those are still under other developed countries’ level, though they have improved quite much recently. The market is not confident of sustainable future growth.
③ Discount Rate-this is the biggest disturbance factor?
Japanese interest rates are almost zero. The low interest rates are often taken as the sign of economic stability. However Japan is in the situation that rates can never increase. Amid 20 years long deflation, zero rate represents the lowest investment return area. Abe Administration targets 2% inflation and that is far from realistic yet. People might consider discount rates stay low as interest rates are extremely low level. Equity Risk premiums of 4-6% are applied in most of research firms.
However risk premium might be something which alternate with each equity, though analysts tend to apply just one rate. For example, Toyota is followed by many analysts and research reports are issued quite often. It is not realistic to apply same discount rate for Toyota and other small sized firms which are not covered by any analysts. Although people might consider discount rates stay relatively low due to historically low interest rates, discount rates might be extremely high level inversely other market rates and affect stock price level.
Consequently the direction of Japanese equities is dependent of Innovation in Japanese productivity
I have observed 3 factors but they are something “given” and it is close to static analysis. The real factor to drive stock prices should be the dynamic change of corporate activities.
The biggest challenge for Japanese economy is “Short of labor force”. This is not due to cyclical issue like heated economic activities but due to demographic trends of small number of young generations which will be more serious in the future. The Government takes measures of “Work style reform” to enhance productivity.
I had worked in UK and Germany in 80-90 years, not only in Japanese firm’s local corporations, but also in local firms’ offices. I was surprised to see German colleagues use time quite efficiently while they took full holydays. Concerning labor productivity, Japan is around 70 against 100 of the US while Germany and France are around 90. Japanese workers take very few holidays and often work until midnight. This level of productivity must be quite shocking.
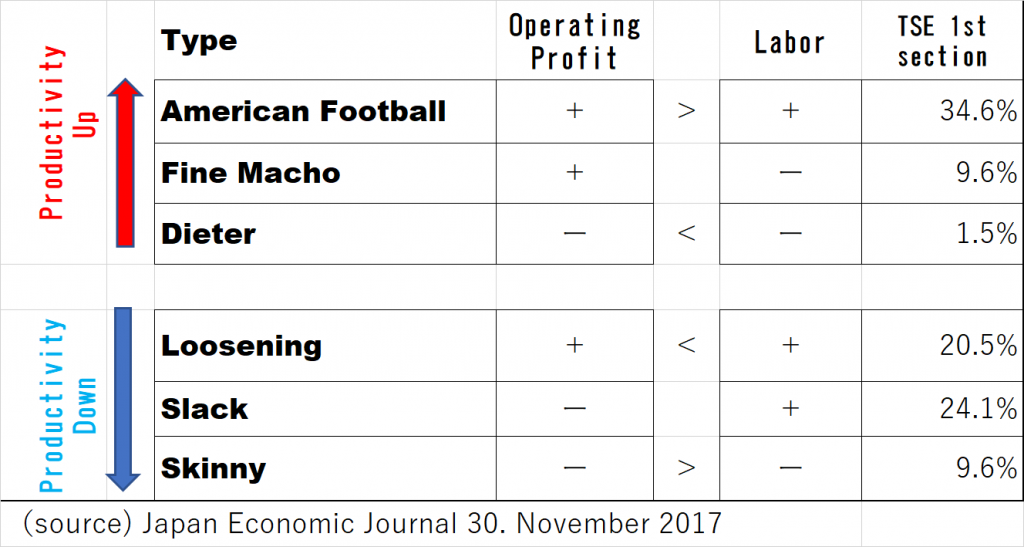
Japan Economic Journal (27. November 2017) posted very interesting survey results. The chart below shows groups of improving productivity and deteriorating productivity classified by each type in last 10 years.

The survey picked up Operating profit and Labor forces and analyzed their up and downs in 10 years to categorize them. The strongest type which increased Operating profit more than that of labor forces is called “American Football” type. In contrast, the worst group which decreased Operating profit more than that of labor forces is called “Skinny” type. As a result, improving groups are accounted for 45.7%. The article said this looks as small as less than half and it is serious issue. However I had another impression. I have made deep dive research into many Japanese listed firms and I had expected “Fine macho” type, apparently “reduction equilibrium” type, would be more than 1/3. The survey looked slight sign of potentiality of effectivity improvement of Japanese corporations.
After the world war, Japanese Economy had come over a lot of crisis and realized long term high growth. For example, public pollution had become fatal issue in rapid growth of corporate production activities, just like China in modern days. Nevertheless Japan nowadays is often taken as one of “Eco-leading nations. Japanese long history has been always “Scrap & build”. Once it decides way, people head for same direction all at once. But just before the catastrophe, it suddenly changes direction and head for new stage. In recent days, Japan is suffered from unprecedented aging and shortage of labor force. If Japan could overcome this production crisis by productivity improvement, the expectation toward future returns of Japanese equities will improve all at once. This is off course nothing to do with “analysis” but so many unhappiness had come out from Pandora’s Box after bubble economy crash, we now have to see the last hope.
