日本株は割安か?/Are Japananese Equities relative cheap?
<株価指数をみる限り“置いてきぼり”は明らか>
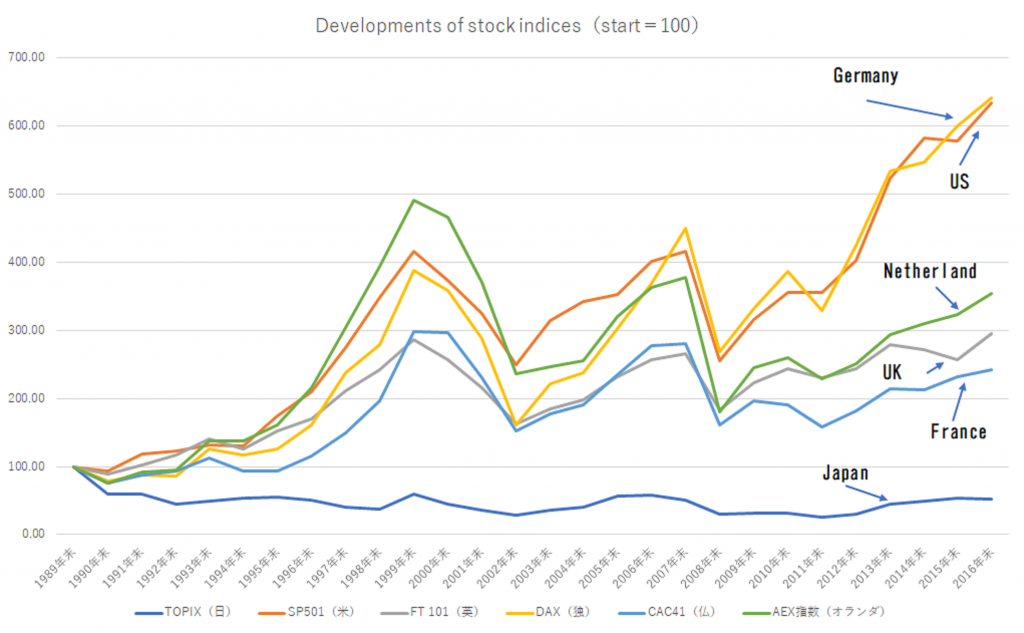
グローバルに見て日本株は“割安”だという議論をよく聞く。先進国の株式市場の中で、日本が最も出遅れており、いったん反転のチャンスがあれば上値のポテンシャルは大きいというものだ。特にバブル崩壊以降に“失われた20年を経ても、なお本格的な株価指数の反転を見ない現状を見る限り、確かに日本の株は出遅れているように見える。下に各国の代表的な株価指数の89年末以来の推移(各指数とも起点=100)をチャートにしてみた。89年末(日本にとってはバブルのピーク)を100とした場合の昨年末の水準は、ドイツ、アメリカが起点の7倍以上になっているのに比べて、TOPIX指数はわずか52%程度、26年を経て未だに半分の水準でしかない。確かにこれを見る限り、日本株式市場がグローバル比較の中で”置いてきぼり“を食らっているピクチャーが鮮明に見える。その意味で「日本株の割安」を叫ぶ声があってもまったく不思議はない。
<“Left behind” situation is obvious as far as looking at stock indices>
People often say that Japanese equities are relatively cheap among developed countries and they expect upward potential is huge once the market finds the chance of invertion. Especially after the Bubble crash in 1990, Japan had spent the period of “Lost 20 years” and the stock index have not showed substantial upturn yet. The chart below is developments of representative stock indices of major markets after 1989. If you set the level of 1989 end at 100, US and German markets are already become more than 7times higher, on the other hand, TOPIX index is around 52% level, just a half of 1989 level. As far as looking at indices, the relative cheapness of the Japanese market looks quite clear. It is no wonder that people see the relative cheapness of Japanese market.
(English text continues to the latter half of the page)

<株価指数は本当に市場の実勢を表しているのか>
ただここで疑問が湧くのは、本当にTOPIXという指数が日本の株式市場そのもののパワーと水準を正確に表しているのか、といった点。TOPIX指数は東証1部に上場する全株式の時価総額合計を基準とした指数。その意味では日経225指数のように、225銘柄という限られた銘柄の幾何平均方式よりも、東証1部全体の真の実力、特に時価総額の大きく市場の代表的な銘柄の値動きをかなり正確に表しているように思える。しかし次のチャートを観てほしい。
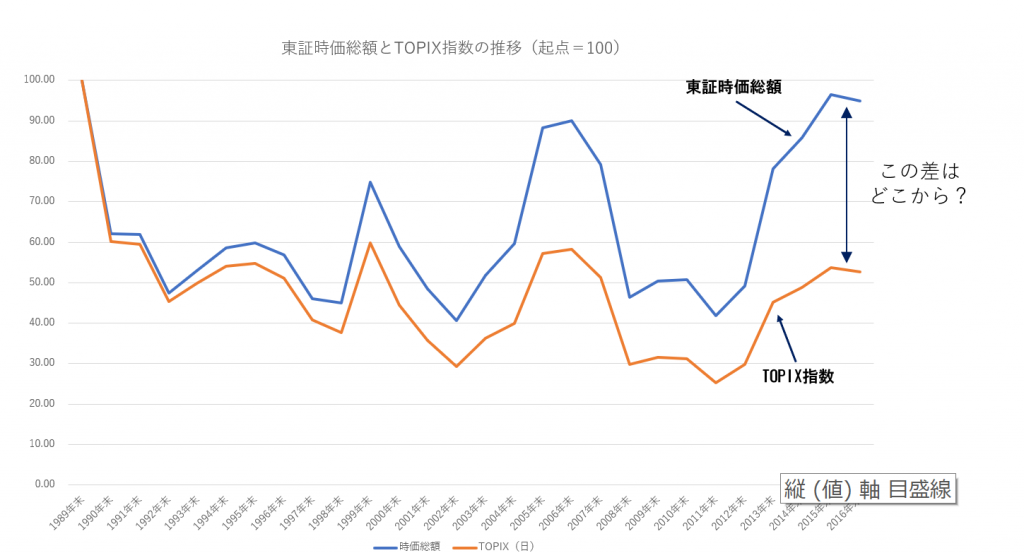
これは東証全体の時価総額とTOPIX指数のやはり89年末からの推移を見たもの。これを見ると、TOPIX指数自体はバブル崩壊時の半分程度のところに留まっているものの、東証の時価総額トータルではすでに直近でほぼバブル崩壊時の水準に近づいている。両社の違いは、TOPIX指数は東証1部上場銘柄だけの時価総額を対象にしているのに対して、東証時価総額には1部のほか、2部、JASDAQ 、MOTHERS市場を含んでいるという点。時系列でみると90年代当初は両者の推移はほぼ同一だが、その後に徐々にそのスプレッドを広げている。特に2013年に東証が大証と統合され、同時にJASDAQ市場も東証に包含されたことを契機にさらに急拡大をしている。
一言で言ってしまうと、このスプレッドが表すものは
『東証1部市場の新陳代謝の鈍さ』
ではないか。時代が育む成長企業は、時代の流れとともにその方向性を変えていく。たとえばダウ工業株30種平均株価指数は1884年から算出されている世界の株価指数の嚆矢ともいえる代表的株価指数だが、算出が始まって以来継続して採用されている銘柄はゼネラル・エレクトリックだけ、1990年以降だけで見てもすでに23銘柄が入れ替わっている。時代の流れが起こす産業構造の変化を正確に反映させるのも株価指数の機能でなければならない。
これに対して東証1部の時価総額構成が必ずしも時代にマッチした構成になっているとは思えない。いったん東証1部に上がってしまえば、相当のことがない限り上場廃止になることはない。東証の上場基準は先進国の中でも非常に厳しいものがあるが、上場廃止の基準はかなり緩く、結果として市場の中にはほとんど取引も行われなくなった“ゾンビ上場”がかなり厚く沈殿している。入るに厳しく、しかしいったん入れば滅多に出ていかないという構造は、日本の大学制度にも似ている。時代の波が湧き起こす新しい成長産業は東証1部よりもむしろJASDAQやMOTHERS市場の方に偏在しているのではないか。その意味でTOPIX指数の出遅れを以て日本株式の割安を断じることには戸惑いを感じる。
<時価総額はすでに名目GDPを超えている>
ここで株価指数ではなく、もうひとつの指標を見てみよう。次のチャートは東証全体の時価総額を名目GDPで除したもの。これはバブル崩壊以降、自分でいつもひとつの指標にしていたものですが、最近になってこれが「バフェット指数」と呼ばれていると知った。
統計の関係で94年以降からのチャートになっているが、バブル崩壊当時はこの指標が確か140%を超えていたと記憶している。一時は50%を割り込んだこの指標(逆に言えば、50%が強力な下値支持線となった形)は、直近ではすでに100%を超えている。さらに直近のTOPIX水準である1750で試算してみると、この指標は120%に近いところまで達している。これはTOPIX指数の推移だけを見ていたのでは、考えられない回復度合いだ。
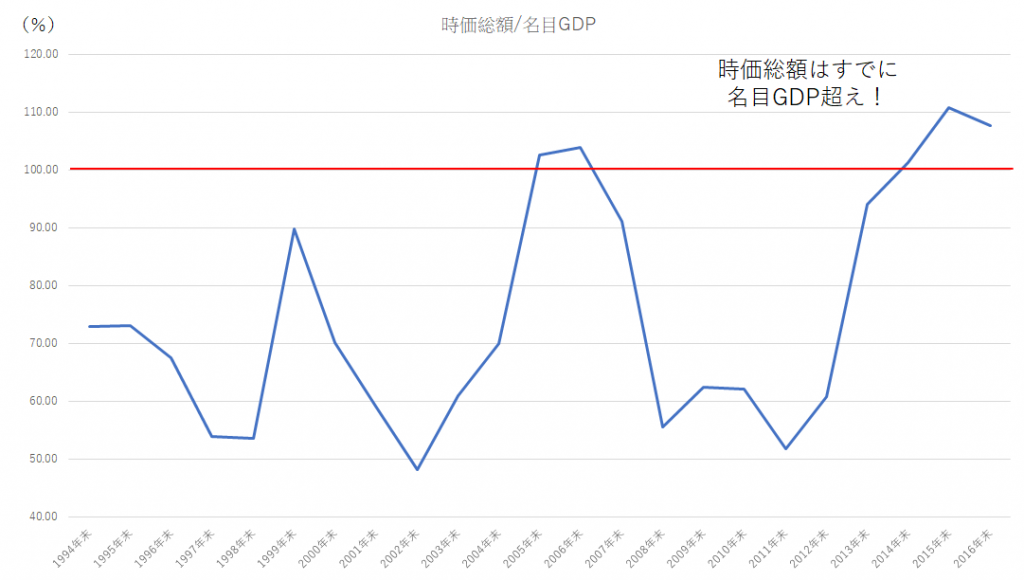
この指標はアメリカの直近時点ではすでに140%になっており、これは2001年ITバブル崩壊直前のレベルをすでに超えている。実は日本もすでにその水準に近いところにいるわけだ。
少なくとも国内株式の時価総額が、実体経済の総和である名目GDPの水準を超えていることを考えれば、冒頭で見た日本株の単純な「割安感」はその根拠に乏しい。もちろん株価は現在の企業価値に加えて、将来にわたって生み出される価値の総和を現在価値に割り引いたものも含むわけなので、今後の成長力が非常に高い場合には株式時価総額が名目GDPを大きく上回っても違和感はない。すなわち現在の日本の時価総額水準(これは株価水準とほぼ同義)を受け入れるかどうかは、ひとえに日本の今後の成長力をどのように観るかにかかっている。
しかし政権与党が大勝利を納めて経済政策が遂行しやすくなっているとは言え、積年の課題であるインフレ率2%台の目標は依然として遠く、長期金利もゼロ水準に張りついたままだ。日本は“世界で最も投資収益率の低い国”というラベルはまだ剥がせない。少なくとも自分が運用ポートフォリオを組む際には、むしろ国内株式のウエートはかなり低いところに抑えるべきと考えている。
Are Japanese equities relatively cheap?
<“Left behind” situation is obvious as far as looking at stock indices>
People often say that Japanese equities are relatively cheap among developed countries and they expect upward potential is huge once the market finds the chance of invertion. Especially after the Bubble crash in 1990, Japan had spent the period of “Lost 20 years” and the stock index have not showed substantial upturn yet. The chart below is developments of representative stock indices of major markets after 1989. If you set the level of 1989 end at 100, US and German markets are already become more than 7times higher, on the other hand, TOPIX index is around 52% level, just a half of 1989 level. As far as looking at indices, the relative cheapness of the Japanese market looks quite clear. It is no wonder that people see the relative cheapness of Japanese market.
<Does stock index truly represent the real picture of the market?>
A doubt comes out. The question is whether TOPIX index truly represent the power and levels of Japanese stock markets. TOPIC index is calculated from the sum of market capitalizations of all listed firms of 1st section of Tokyo Stock Exchange (TSE). In this mean, TOPIX index represents movements of large cap firms better than Nikkei 225 which is calculated from single stock prices of 225 firms through geometric mean method (like Dow Index). Even so could you take a look on the chart below?
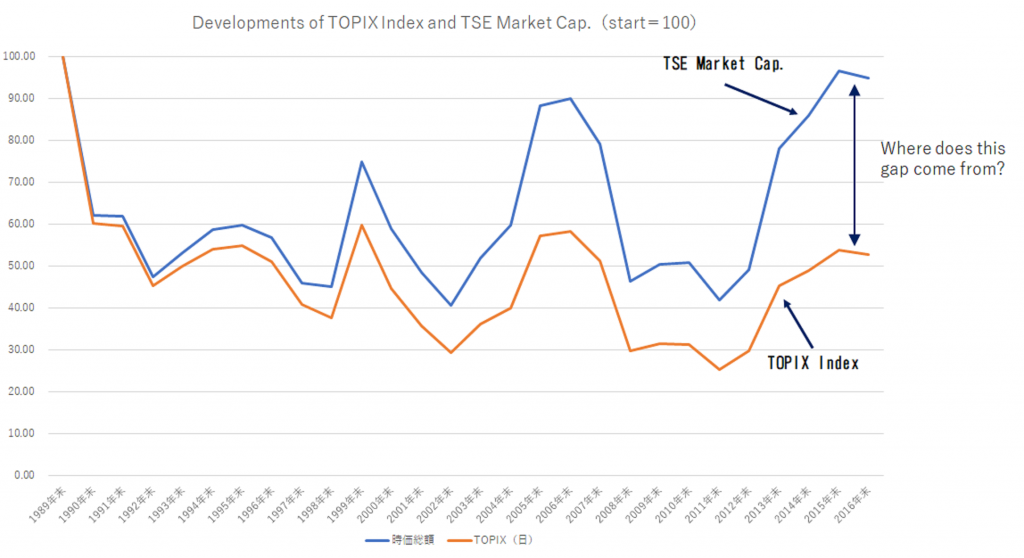
This chart shows developments of TOPIX index and total market capitalization of TSE. While TOPIX index stayed at half the level of Dec.1989, total market capitalization has already recovered almost to the Bubble level. The difference between 2 indicators is that TSE total market capitalization include 2nd section, JASDAQ, and MOTHERS markets and 1st section while TOPIX handles only TSE 1st post. When you observe both developments in chronological order, both indicators made almost same movements in early 90s. Then the spread has become wider as emerging markets like JASDAQ and MOTHERS have grown, and after the integration of TSE and OSE (Osaka Stock Exchange) in 2013 the spread widened more.
In one word, this tendency could represent
“Dull metabolism of TSE 1st section”.
The wave of times gives growth chances to companies and it changes its direction all the time. For example, Dow Jones industrial average 30 index is the most traditional and representative stock index which was incepted in 1884. And it is only General Electric which has stayed in the index till now. Even after 1990, 23 stocks have changed places. The index must change its contents in order to match changes of time.
On the other hand, listing standards of TSE 1st section is quite strict among developed countries however the listed companies are seldom delisted once they are listed. Therefore there are a number of “Zombie firms” which are almost not traded daily in the market. The picture of so difficult to enter and easy to stay in looks like the College system in Japan. The markets like JASDAQ or MOTHERS represent growing chances brought by the wave of time rather than traditional 1st section. By this I mean it is difficult to discuss the relative cheapness of Japanese equities only from Index movements.
<Total market cap already exceeds nominal GDP>
Then I present the chart from another perspective. The chart below is the division of market capitalization by nominal GDP. Although I have used this indicator for a long time, I recently found out this is called the “Buffet index”.
Starting point is 1994 but this figure was over 140% at the peak of the bubble. The indicator had once gone under 50% (conversely 50% level looks quite strong support line) but it has recovered over 100% now. The latest TOPIX level of 1750 is equivalent of 120% of the indicator. You can never imagine this recovery if you stick only to index movements.
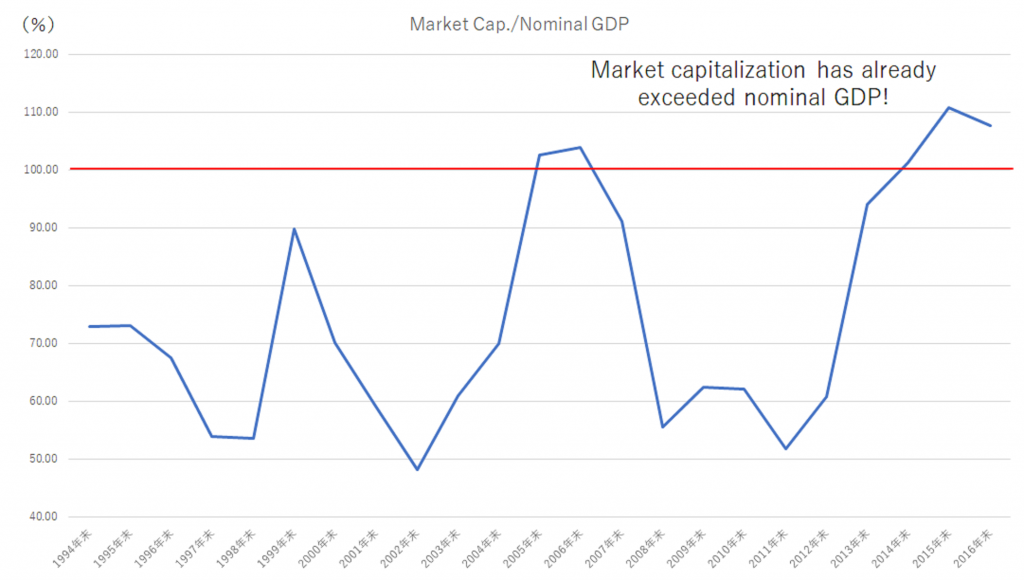
In the US, this indicator is over 140% , more thanJapanese level. Incidentally This indicator had gone to 140% before the crash of the IT bubble in 2001, so that this 140% level could be an warning level which indicates “bubble”.
When you realize that total market capitalization exceeds the nominal GDP which is total sum of economic activities of the country, the discussion of “relative cheapness of Japanese equities” has poor basis. Off course stock prices include not only outstanding value like cash flow or net asset, but also discounted present value of future potential cash flow of companies as going concerns. If growth potential is quite big, then total market capitalization (it is nearly equal to levels of stock prices) can exceed nominal GDP. Therefore the issue how to consider this indicator is solely dependent on how you see the future growth potential in Japan.
Although the LDP Government made a landslide victory at the last election, the mid-term target of 2% inflation is still far from being realized. The long-term interest rates are stuck to zero level and Japan cannot evacuate from the label of the country with “the lowest investment return”. At the very least I can no longer compose a domestic equity oriented portfolio for myself.
